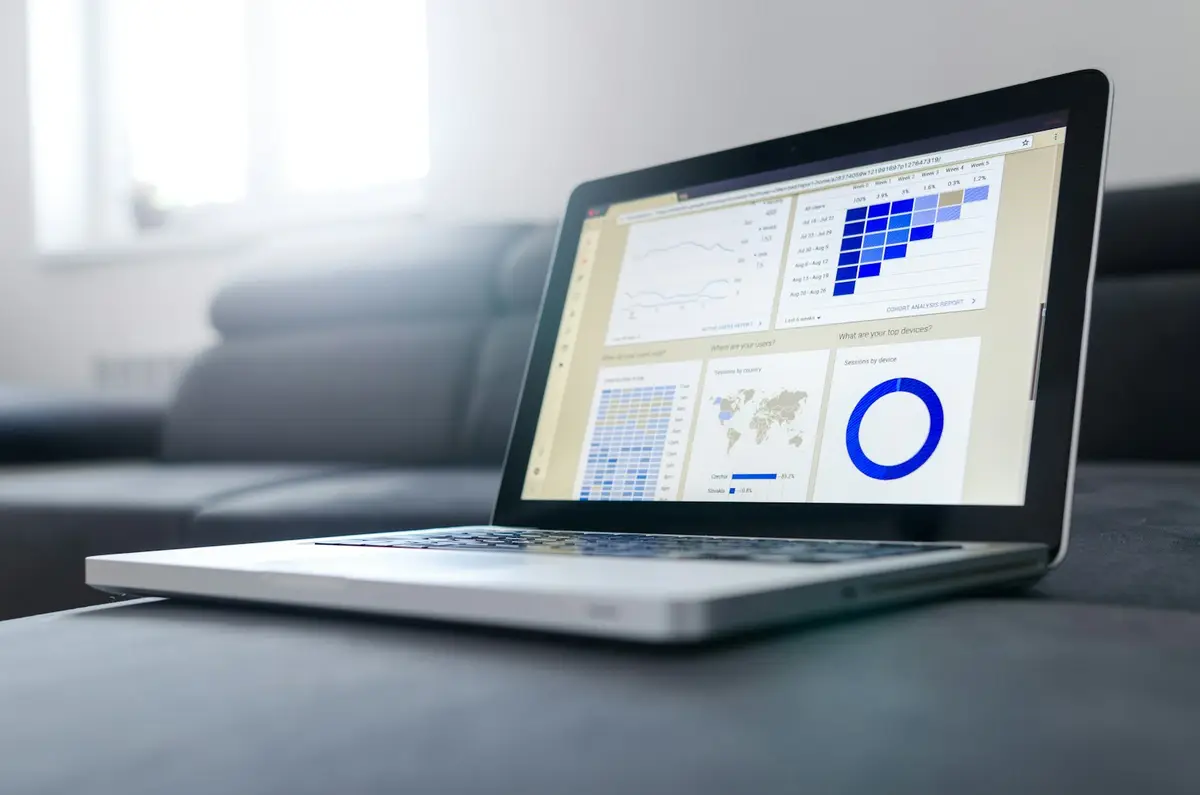
One screen, every system
Operations, sales, finance — pulled from the tools you already run and assembled into one live view. No exports, no copy-paste, no Friday reporting ritual.
01What you get
Operations, sales, finance — pulled from the tools you already run and assembled into one live view. No exports, no copy-paste, no Friday reporting ritual.
Margin by job, by lane, by customer, by crew. Idle time, cycle time, team load. Not a standard report — the picture assembled for one business: yours.
Every number opens into the records behind it. When the margin dips, you see which jobs, which customer, which week — and who to call about it.
Ask the dashboard a question the way you'd ask an analyst — "which customers slipped this quarter?" — and get the chart and the list, not a query language.
02In practice
Margin by lane, deadhead, and carrier performance in one live view.
Explore → IndustryBay utilization, parts margin, and comeback rate without a single export.
Explore → IndustrySales, inventory, and fulfillment from every channel on one screen.
Explore →03Works with
04How we work
We sit inside the process and watch how it runs today — the steps, the exceptions, the judgment calls, and every tool it passes through.
Not a mockup and not a deck. The first version you can actually use, in weeks rather than quarters.
The system goes into your environment and connects to what you already run. It takes the routine path and hands the rest to a person.
We agree what better means before we start — time, errors, throughput — and report against it. The next process begins once the first one has earned it.
05Questions we hear
It's the normal starting point. Cleaning and connecting the data is part of the build — and the dashboard is usually what finally makes the mess visible enough to fix.
A tool isn't a picture. If your team already lives in a BI tool, we'll build there. What we add is the part that takes months: the pipelines, the modeling, and views that match how you run the business.
As live as the decision needs. Dispatch boards update in seconds; financial views usually don't need to. We match the refresh to the question, not the other way round.
Tell us about the work your team dreads. We'll come back with what a working system would look like — and what it would take to prove it.